Most ways of proving you can audit a system are unfalsifiable. A sample report about an invented company shows you can write like an auditor. It cannot show the method finds anything real, because every number in a fictional report is one you made up.
So I ran a full operations audit on the one system where I have complete access and complete permission to publish everything it turns up: my own production fleet of LLM agents, running on OpenClaw, operated by one person. Between 14 and 17 of them, and the fact that I cannot say exactly which is itself one of the findings.
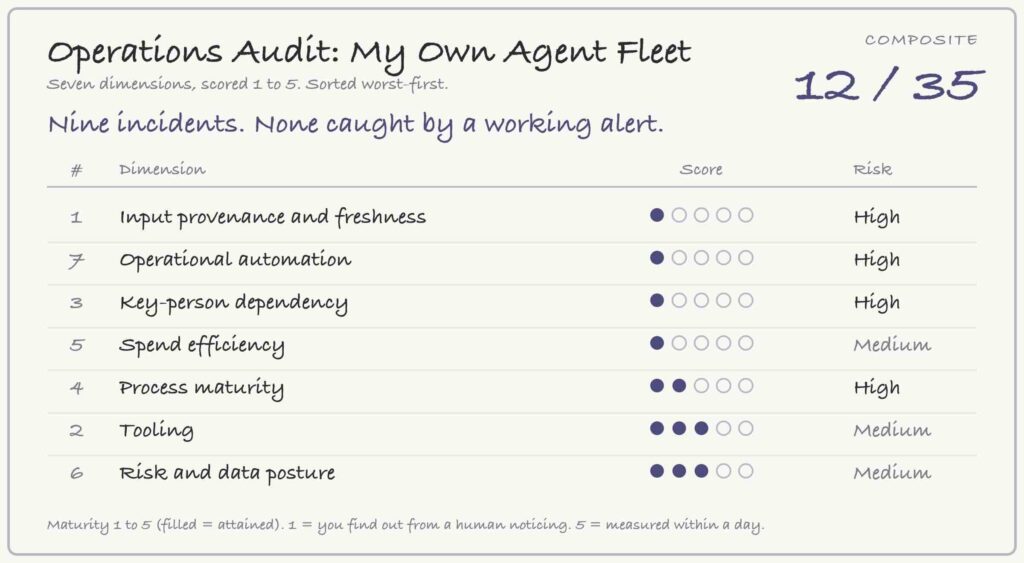
It scored 12 out of 35. Across nine incidents in the review period, effectively none was caught by a working alert. Every one was found by a human noticing something was off: unchanged output, a missing briefing, an unanswered ping, a wrong sender name. The longest silent failure ran about ten weeks before anyone spotted it.
That is the finding the whole document circles, and it is why agent fleets fail in a way infrastructure monitoring never catches. Agents rarely crash. They keep talking.
What follows is the audit itself, published in full, including the parts that do not flatter me. It is the sequel to an earlier post on what running this fleet taught me: that one told the failure stories, this one scores the system that produced them. Every number below traces to a real source that was read to produce it.
Operations Audit: My Own Agent Fleet
Subject: a 14 to 17 agent LLM fleet running on OpenClaw, in production, operated by one person. The range is itself a finding (see Section 3)
Auditor: Aakash Sharan · Client: me · Period reviewed: 2026-05-09 to 2026-08-06 (gateway log retention, ~90 days)
Published in full, including the parts that do not flatter me.
Why this document exists
There is an honest way to show an audit method works, and a dishonest one. The dishonest way is a polished sample report about an invented company. It proves you can write like an auditor, but every number in a fiction is unfalsifiable, so it proves nothing about the method.
So I ran the audit on the one system where I have complete access and complete permission to publish: my own.
Every finding below traces to a real source: openclaw.json, crontab -l, journalctl, files on disk. Where a number could not be pulled, this report says so rather than estimating, because in an audit about observability an instrumentation gap is a finding rather than an inconvenience.
How to read the confidence markers
| Marker | Meaning |
|---|---|
| ✅ | Pulled from a named source and checkable |
| ⚠️ | Derived or proxied, with the basis and its limits stated inline |
| ❌ | Not instrumented. This is a finding, not an omission |
Excluded from this report: three agents holding private personal data, and the subject matter of several agents whose work isn't mine to publish. Roles are abstracted where content would reveal either. No credentials were read; only provider type was inspected.
0. At a glance
The composite is 12 out of 35. I score my own operation lower than the fictional company in my sample report, which is the correct outcome. A scoring instrument that flatters its author is not an instrument.
| Incidents in the review period | 9 |
| Caught by a working alert | ✅ effectively 0 |
| Longest silent failure | ✅ ~10 weeks |
| Models hard-pinned | ✅ 14 of 14 (100%), and the declared fallback is the same model |
| Fleet headcount | ✅ 14 in config · ⚠️ 17 on disk · ✅ 9 on Slack |
| Operator noise | ✅ 27 failed-tool traces in 14 days, after the fix |
| Bus factor | ✅ 1 |
The finding, stated once: the infrastructure monitoring on this fleet works. The backup watchdog fired correctly on 4, 5 and 6 August. The wifi watchdog logged 264 reconnect events. What is missing is any check on whether an agent produced something true: whether it ran, whether its input was fresh, whether anyone read the output.
Every one of the nine incidents was found by a human noticing something was off. Unchanged output. No reply. A wrong sender name. A briefing that stopped arriving.
Agents rarely crash. They keep talking.
1. Scope, method and limitations
Examined ✅
Active configuration (~/.openclaw/openclaw.json) · operator crontab · gateway journal, retention to 2026-05-09 · 17 agent workspace directories and their memory files · OpenRouter auth-profile types · an existing incident dossier covering six prior failures · three further incidents from the current session.
Not examined
Cost per agent (see Section 5, not possible with current instrumentation) · alert true-positive rate (not centrally logged) · anything belonging to the three excluded private agents · model output quality. This is an operations audit, not an evaluation of whether the agents produce good work.
Their absence from this report is not a clean bill of health.
Limitations, stated
The gateway journal reaches back roughly 90 days, so anything older is reconstructed from the incident dossier rather than from logs. The activity counts in Section 2 are a proxy (distinct nested run-ids) that conflate scheduled runs, chat, and agent-to-agent chaining. They show that the fleet is far more event-driven than the cron list implies. They are not run counts, and I have not presented them as such.
Requested and not obtained
Per-agent spend. It is not withheld; it does not exist. See Section 5.
One thing I could not verify and therefore removed
An earlier draft carried a roughly six-week silent window on a backup failure. The broken-watchdog half of that incident is verified; the duration is not. It has been dropped rather than published soft.
2. What already works
Reported first because it is true, and because it makes the rest of the report legible. An operation that fails at everything is a different diagnosis from one that fails at a specific thing.
Infrastructure monitoring is real and it fires. ✅ The backup watchdog logged OK: backup completed on 4, 5 and 6 August. Temperature checks run every 15 minutes. A web-fetch guardrail audit runs every 15 minutes. This is not decorative monitoring; it works.
The wifi watchdog quantified a real problem. ✅ 264 reconnect and restart events logged. Two outages traced to network instability, and the instrumentation was there to prove it.
Backups are solid. ✅ General backup daily at 03:00 with a 05:00 watchdog, verified firing. Private memory is GPG-encrypted and shipped offsite daily.
Credential handling is clean. ✅ Tokens live in a dedicated credentials store and auth profiles. Nothing was exposed to build this report; only provider type was read.
At least once, a fix was hardened rather than patched. ✅ The DNS boot-race in Section 4 was closed with a network-online plus DNS-ready boot gate, not a retry loop.
It does not hold as a general habit, and the counter-example is in this report: the memory-truncation mitigation went the other way, per-agent overrides rather than a systemic fix. Dimension 6 scores it accordingly.
The pattern is consistent: anything with a machine-checkable success condition is monitored. The gap is everything whose failure looks like normal output.
3. Scorecard: 12 / 35
Seven dimensions, scored 1 to 5. 1: if this fails you find out from a human noticing. 2: exists but improvised per instance. 3: written down and mostly followed, still manual. 4: tooled and consistent, exceptions have a defined path. 5: measured; you would know within a day.
Risk is scored independently of maturity, on exposure if the thing fails. Rows are sorted worst-first; the # column is the dimension number, so it does not run in order.
This scale is mine. It is a maturity ladder in the CMMI tradition applied to seven dimensions I chose because they are where operations work fails. It is not an industry benchmark and a 12/35 here is not comparable to anyone else's score. The evidence column is there so the scores can be argued with.
| # | Dimension | Evidence | Score | Risk |
|---|---|---|---|---|
| 1 | Input provenance and freshness | ❌ No output-to-input traceability. Given a synthesis, you cannot reconstruct which inputs produced it. No check on whether a scheduled agent's input is fresh, stale, or absent. This blindness directly caused the 10-week failure in Section 4 | 1 | High |
| 7 | Operational automation (how much of running this fleet is itself automated) | ✅ Across 9 incidents, effectively 0 were caught by a working alert. Detection is human-eyeball. ❌ Heartbeats present in the runtime but disabled | 1 | High |
| 3 | Key-person dependency | ✅ 14 to 17 agents, one operator, one owner. Every incident in Section 4 was detected by that one person. Nothing is documented to a standard another operator could take over from | 1 | High |
| 5 | Spend efficiency | ✅ All agents authenticate through one shared API key. ❌ No usage log running; one existed in March and is now only a backup file. Per-agent cost cannot be computed. ✅ Orphaned infrastructure identified: a decommissioned control panel, ~20 disabled cron jobs, 4 workspaces with empty memory | 1 | Medium |
| 4 | Process maturity | ✅ Config lists 14 agents, disk holds 17 workspaces, Slack has 9 accounts, three counts, no single source of truth. ✅ Agent self-descriptions contradict actual plumbing: one declared continuous monitoring while running weekly. ❌ No per-cron success ledger, so declared cadence cannot be compared against actual | 2 | High |
| 2 | Tooling | ✅ The platform supports scheduling, heartbeats and guardrails. Infra monitoring is configured and verified working (Section 2). ❌ The agent-output layer of that same tooling is unused, heartbeats disabled, no freshness checks. Capable tooling, half-implemented | 3 | Medium |
| 6 | Risk and data posture | ✅ Backups daily and verified. ✅ Private memory GPG-encrypted offsite. ✅ Credentials segregated. ⚠️ Memory injection cap silently drops the middle of oversized files; now mitigated per-agent, but the mitigation is manual and per-agent rather than systemic | 3 | Medium |
Composite: 12 / 35. Sorted worst first.
Read the shape. Dimension 2 scores 3 and dimension 7 scores 1, sitting next to each other: the tooling to fix this is already installed and paid for. Heartbeats exist in the runtime and are switched off. That is the same diagnosis I wrote for a fictional facilities company, the systems were bought and never connected, which is either evidence the pattern is general, or evidence I should take my own advice.
4. Risk register
Nine incidents in the review period. Each is tagged R1 to R9 in the table below and referenced by that tag in the opportunities and plan that follow. Detection latency is the column that matters, because it converts a list of anecdotes into a measure of how long this operation runs on false information.
| # | Risk | Severity | Evidence | Detection latency |
|---|---|---|---|---|
| R1 | Agent-output blindness. Nothing verifies that a scheduled agent ran, that its input was non-empty, or that anyone consumed its output | High | ✅ A synthesis agent produced confident weekly summaries for ~10 consecutive cycles after a scheduler change silently cut off its input. Nothing alerted, because nothing was down | ~10 weeks |
| R2 | No effective model fallback. 14 of 14 agents hard-pinned. The default's declared fallback is the same model it falls back from | High | ✅ ~20 scheduled jobs pointed at a retired model and failed silently. Surfaced when expected briefings stopped arriving | ~12 days |
| R3 | Bus factor 1. One operator, one owner, 14 to 17 agents | High | ✅ Every incident here was detected by the same person. An absence of two weeks is an undetected-failure window of two weeks | standing |
| R4 | Failure asymmetry hides outages. A component can fail in one direction while appearing healthy in the other | Medium-High | ✅ After a reboot, all 9 Slack-connected agents went inbound-deaf, a one-shot auth check hit DNS-not-ready and disabled mention detection, while outbound posting kept working. Everything looked alive | ~2.5 hours |
| R5 | Wrong-identity delivery. An agent can post as another agent | Medium | ✅ A synthesis agent posted its weekly output under a different agent's identity, bleeding work into the wrong channel | ~3 days |
| R6 | Silent memory truncation. Injection cap of 12,000 characters per file keeps the head and tail and drops the middle | Medium | ✅ One publishable example: a 14.6 KB memory file against a 12 KB cap. Without a per-agent override it silently loses the middle of its own memory, and reasons on the remainder | invisible until audited |
| R7 | Alert fatigue as a risk multiplier. Noise trains the operator to ignore the channel where real alerts arrive | Medium | ✅ 27 failed-tool traces reached the operator's direct messages in 14 days, roughly 2 per day, after the originating bug was fixed | ongoing |
| R8 | Configuration drift. Config, disk and Slack disagree about which agents exist | Medium | ✅ 14 / 17 / 9. Also: agent self-descriptions contradicting their actual schedules | standing |
| R9 | No provenance. An output cannot be traced back to the inputs that produced it. This is the forensic facet of R1: R1 is not knowing a failure is happening, R9 is not being able to scope it afterwards. Listed separately because they are fixed by different work | Medium | ❌ Not instrumented. Consequence: after R1, there was no way to determine which past outputs were affected | n/a |
The meta-finding. ⚠️ Alerts are not centrally logged, so a true-positive rate cannot be computed. What can be stated: across these nine incidents, none was surfaced by a working alert. Each was found by a person noticing unchanged output, a missing briefing, an unanswered ping, or a wrong sender name. The one monitor that should have caught a backup failure was itself broken.
5. Cost: metered in aggregate, unattributable in detail
This is the section where I expected to find a number and instead found a hole.
✅ Every agent authenticates through one shared API key, metered per token. Total spend is retrievable from the provider dashboard.
❌ Per-agent spend cannot be computed. One key means the provider cannot split by agent, and no local usage log is running; one existed in March 2026 and now survives only as a backup file. There is no per-call record tagging which agent spent what.
So the two questions this section is supposed to answer, what does each agent cost and what fraction of spend produced output nobody read, cannot be answered with current instrumentation.
That inability is the finding. It is the exact analogue of software spend that nobody owns: not overspending, but spending you cannot see. And it is worth more than a dollar figure would be, because it is checkable and it generalises. Most organisations running LLM agents are in precisely this position, one shared key and no attribution, and they discover it the same way I did, by trying to answer a simple question and finding the data does not exist.
⚠️ What can be said honestly about waste without pricing it: the synthesis agent in R1 ran roughly ten consecutive weekly cycles producing output that nobody could use, because its input was empty. That is real spend on unconsumed output. It cannot be priced per agent, and the reason it cannot be priced is R-item material in its own right.
✅ Orphaned infrastructure identified: a decommissioned control panel whose port is now free and whose code is retained but not running · roughly 20 internal cron jobs disabled after the retired-model incident · 4 agent workspaces with empty memory files, either dormant or memory-less by design.
6. Ranked opportunities
Effort is rough T-shirt sizing: S is small, M is medium.
1: Input-freshness and consumption check · effort S · the one that pays for the rest
For every scheduled agent, record when its input last changed. Alert when a scheduled consumer runs against input that is stale or absent.
Would have caught R1, the ten-week failure, on the first cycle rather than the tenth. Would have caught the pattern behind R2, since jobs against a retired model produce no output to consume.
The inputs already exist on the machine: file modification times, the cron schedule, and gateway run logs. Nothing new needs to be collected.
Status: specified, not yet built. I am not going to claim a demonstration I have not run.
2: Per-cron run ledger · effort S
Record every scheduled invocation with its outcome. Makes declared cadence checkable against actual cadence, which is currently impossible and is the reason R8 persists.
3: Alert hygiene · effort S
Route tool-failure traces away from the operator's direct messages into a log. ✅ 27 in 14 days is roughly 2 per day of false signal in the same channel where genuine alerts would arrive. Fixing R7 is a prerequisite for any alerting work being useful, because an alert channel the operator has learned to skim is not an alert channel.
4: Single source of truth for the fleet · effort S
Generate the inventory from one place and reconcile config, disk and Slack. Closes R8.
5: Cost attribution · effort M
Either per-agent keys or a local usage log tagging each call with its agent. Makes Section 5 answerable next quarter. Sequenced last because it is the largest change and nothing else depends on it.
6: Model fallback that is not the same model · effort S
✅ 14 of 14 agents pinned, with a declared fallback identical to the primary. Closes R2. Trivial to fix and it caused a 12-day outage.
7. 30 / 60 / 90
| Phase | Actions | Closes | Proof it worked |
|---|---|---|---|
| Days 1 to 30 | Fix the model fallback (#6). Route tool-failure noise out of DMs (#3). Reconcile the inventory to one source (#4) | R2, R7, R8 | A test job against a withdrawn model degrades instead of dying. Operator DM noise falls below 2/week |
| Days 31 to 60 | Build and run the input-freshness check (#1). Add the per-cron run ledger (#2) | R1, and the detection half of R9 | A deliberately stale input triggers an alert before the consumer runs |
| Days 61 to 90 | Cost attribution (#5). Provenance tagging so an output records its inputs | R9, and Section 5 becomes answerable | Per-agent spend for one month, and one output traced end to end |
Then measure the only number that matters here: detection latency. The baseline is in Section 4: 10 weeks, 12 days, 3 days, 2.5 hours. If this plan works, the next incident is found by a machine within a day, and the incident after that never becomes an incident.
8. If I do nothing else
Fix the fallback that points at itself, and get the tool-failure noise out of the channel where real alerts arrive. One is a config line that caused a 12-day outage. The other is what stops me trusting my own alerts.
Everything else on this list is instrumentation. Those two are the ones already actively costing me.
What this audit cost me to admit
Nine incidents. None caught by an alert. A composite lower than the fictional company in my own sample report. A bus factor of one, on a fleet whose reliability I write about.
I published it because a report that only flatters its author measures nothing, and because the question worth asking anyone who audits systems is not whether he is careful, it is whether he will tell you what he found.
Method, dimensions and scoring scale are a single fixed instrument, applied to my own operation exactly as it would be to any other. Every ✅ in this document traces to a named source that was read to produce it. Every ❌ marks something that could not be measured, and each one is a finding.