Introduction
Brief overview of the blog post
Hello, fellow engineers! Looking to dive into the magic behind clustering in machine learning? Well, then you've come to the right place! In this post, we're going to deep-dive into the colorful realm of K-means clustering, a powerful algorithm that might look deceptively simple but hides a beastly level of complexity under its hood.
Importance of Clustering in Machine Learning
But before we dive in, let's take a step back and ask, why should we care about clustering? Well, clustering helps us unearth hidden patterns in data, classify unlabelled data (unsupervised learning, anyone?), reduce dimensions, perform image segmentation, and, at times, impress people at parties.
And here's the kicker: a lot of real-world problems are unsupervised. Your team doesn't always get a neatly labelled dataset (we all wish, right?). That's where algorithms like K-means clustering come into play. It’s a bit like those talented detectives from the noir films, sifting through a messy crime scene and finding hidden connections that no one else can see.
Introduction to K-means Clustering
Alright, now let's get our hands dirty with K-means clustering. The 'K' in K-means represents the number of clusters we want to form. 'Means' comes from the fact that the algorithm finds the 'mean' or the 'center' of these clusters.
So, in simple terms, K-means is all about grouping similar data points together and discovering underlying patterns. To achieve this, K-means looks for a fixed number (k) of clusters in a dataset.
Understanding the Concept
Theoretical Introduction to K-means
K-means is the life of the party in the unsupervised learning shindig!
So, what is this K-means? Imagine you're throwing a costume party, and you want to separate your guests into groups based on their outfits. Spider-Man fans in one corner, Wonder Woman admirers in another, and so on. That's your clustering right there - grouping related data points.
K-means does this in a simple yet effective way: by minimizing the distance between data points and their corresponding cluster's centroid, or the "heart" of each cluster.
Key Concepts: Clusters, Centroids, and the K-value
Let's break down the buzzwords:
- Clusters are like your partygoers' costume groups: all the Spider-Man fans together, all the Wonder Woman fans together, and so on. In data terms, a cluster is a collection of data points that share certain similarities.
- The centroid is the cool dude or dudette everyone in the costume group is surrounding. In the data world, it's the center point of a cluster, calculated by averaging the data points in that cluster.
- The K-value is the number of cool dudes or dudettes you want at your party (i.e., the number of clusters). You decide this value, and it's one of the tricky parts of K-means because there's no one-size-fits-all number. If you choose too few, you'll have Wonder Woman fans arguing with Batman fans. If you choose too many, you'll have separate corners for every Spider-Man movie. It's all about striking the balance.
Understanding Distance Metrics: Euclidean, Manhattan, etc.
Now let's talk about the 'secret sauce' of K-means: distance metrics.
The Euclidean distance is like straight-line distance, a la "crow flies". This is how it looks:
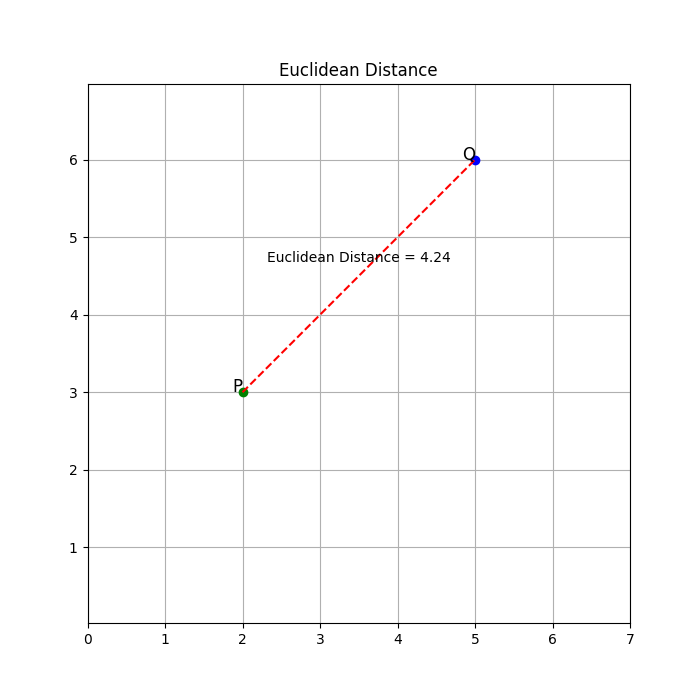
Euclidean distance is the most widely used distance metric in K-means clustering. It calculates the straight-line distance between two points in a multidimensional space. In a two-dimensional space, the Euclidean distance between points (x1, y1) and (x2, y2) is given by the formula:
In general, for n-dimensional space, the Euclidean distance between two points (x1, x2, ..., xn) and (y1, y2, ..., yn) is given by:
Euclidean distance is sensitive to both large and small differences across all dimensions. It measures the "as-the-crow-flies" distance between two points and assumes that all dimensions are equally important.
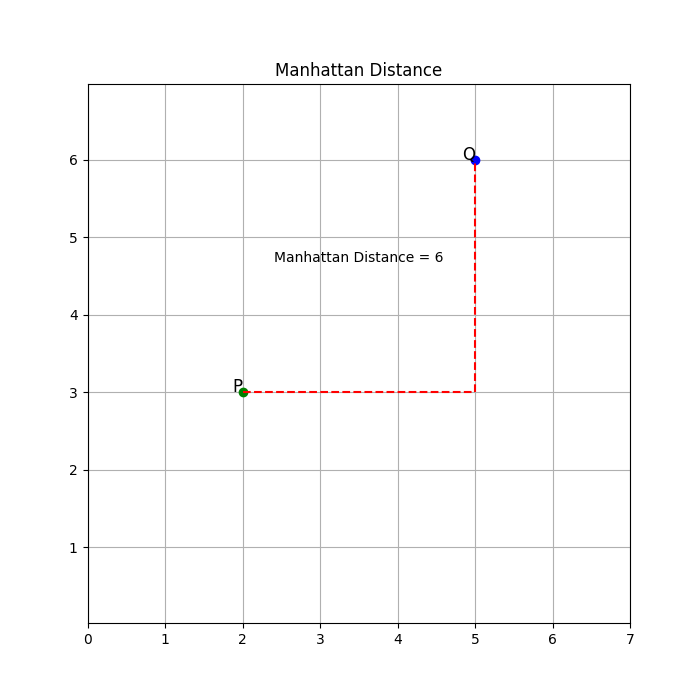
Then, there's the Manhattan distance, named after the grid-like street geography of Manhattan, measures the distance between two points by summing the absolute differences between their coordinates. In a two-dimensional space, the Manhattan distance between points (x1, y1) and (x2, y2) is given by the formula:
In general, for n-dimensional space, the Manhattan distance between two points (x1, x2, ..., xn) and (y1, y2, ..., yn) is given by:
Unlike the Euclidean distance, the Manhattan distance considers only the vertical and horizontal movements and does not consider diagonal movements. It is often preferred when the dimensions have different scales or when differences in some dimensions are more important than others.
Both Euclidean distance and Manhattan distance are valid choices for distance metrics in K-means clustering. The choice between them depends on the nature of the data, the problem at hand, and the specific characteristics of the dataset.
The K-means Clustering Process
Step-by-step Breakdown of the Algorithm
So, you're ready to crank the clustering engine, huh? Buckle up, folks, because we're about to break down the K-means clustering step-by-step.
- Pick your K: Decide on the number of clusters (K). Remember, this is more art than science. You're like a DJ choosing the number of tracks for your next killer set.
- Select Initial Centroids: Take K random data points from your dataset to serve as the initial centroids. This is like your opening track - it sets the vibe but might not be the final crowd-pleaser.
- Assignment Step: Calculate the distance between each data point and each centroid. Assign each data point to the cluster of its nearest centroid. Think of this as the crowd gravitating towards their favourite beats.
- Update Step: Calculate the new centroid of each cluster by averaging all the data points assigned to that cluster. It's like fine-tuning your set based on what gets the crowd moving.
- Iterate: Repeat steps 3 and 4 until the centroids stop moving significantly or a maximum iteration limit is reached. Now, the party doesn't stop until the break of dawn (or when you've reached convergence)!
Here's how you'd implement this in Python:
from sklearn.cluster import KMeans

# Step 1: Pick your K
kmeans = KMeans(n_clusters=3)

# Step 2: Select initial centroids (handled internally by sklearn)

# Step 3 and 4: Assignment and update steps
kmeans.fit(X)

# Get the final centroids and the clusters for each data point
final_centroids = kmeans.cluster_centers_
clusters = kmeans.labels_
How the Initial Centroids are Chosen
Choosing initial centroids is like deciding where to drop in a Battle Royale game: a good starting spot can set you up for victory.
One common method is to select random data points as initial centroids. However, this can sometimes lead to poor clustering or slow convergence if the initial centroids are chosen poorly.
That's why the K-means++ algorithm comes to our rescue. This method chooses initial centroids that are far apart, leading to better and faster clustering. It's like dropping at different corners of the map for maximum coverage.
Here's a quick glance at the K-means++ initialization:
- Randomly select the first centroid from the data points.
- For each data point, compute its distance from the nearest, previously chosen centroid.
- Select the next centroid from the data points with probability proportional to their computed distance. This makes it likely to select centroids far from the already selected ones.
- Repeat steps 2 and 3 until K centroids have been sampled.
And you'll be thrilled to know that sklearn uses K-means++ initialization by default. Isn't that a relief?
kmeans = KMeans(n_clusters=3, init='k-means++')
The Iterative Process of Reassigning Points and Recalculating Centroids
Next on our agenda is the iterative process of K-means. Think of it as a salsa dance between data points and centroids—two steps forward, one step back until everyone finds their groove.
Step 1 - Reassigning Points: In this step, every data point takes a spin with each centroid, measuring the distance between them. The data point then chooses to dance with the centroid closest to it (as in Euclidean distance, remember?). Each data point is assigned to the cluster of the centroid it's dancing with.
Here's how it looks in Python:
# We're assuming you've initiated your KMeans object as 'kmeans'
clusters = kmeans.predict(X)
Step 2 - Recalculating Centroids: After the points have chosen their partners, the centroids update their position by calculating the mean of all the data points dancing with them. It's like the centroid is trying to position itself in the middle of all its dance partners.
And again, in Python:
# Sklearn handles this internally, but here's how you'd do it manually
new_centroids = np.array([X[clusters == i].mean(axis=0) for i in range(kmeans.n_clusters)])
These steps are repeated until the dance is perfectly choreographed, i.e., until the centroids stop moving or a maximum iteration limit is reached.
Criteria for Stopping the Algorithm
So when does the music stop? When do we know that our algorithm has done its job and our clusters are as good as they're going to get?
There are a few signs to look for:
1. Centroids Have Stopped Moving: If the centroids aren't changing their positions significantly between iterations, it's safe to say that they've found their ideal spot on the dance floor.
2. Maximum Iterations Reached: Sometimes the party has to stop, even if everyone's still dancing. Setting a limit on the number of iterations can prevent the algorithm from running longer than necessary.
3. Minimum Centroid Movement: We can set a threshold for how much the centroids move. If the change in centroid positions is less than this threshold, we stop the algorithm.
4. No Reassignments: If in an iteration, no data points change their cluster assignments, it means everyone's found their preferred dance partner. Time to stop the music!
In sklearn, you can set these using the 'tol', 'max_iter', and 'n_init' parameters:
kmeans = KMeans(n_clusters=3, init='k-means++', max_iter=300, tol=0.0001)
And with that, we've covered the rhythmic dance of K-means clustering.
Choosing the Optimal Number of Clusters
The Elbow Method
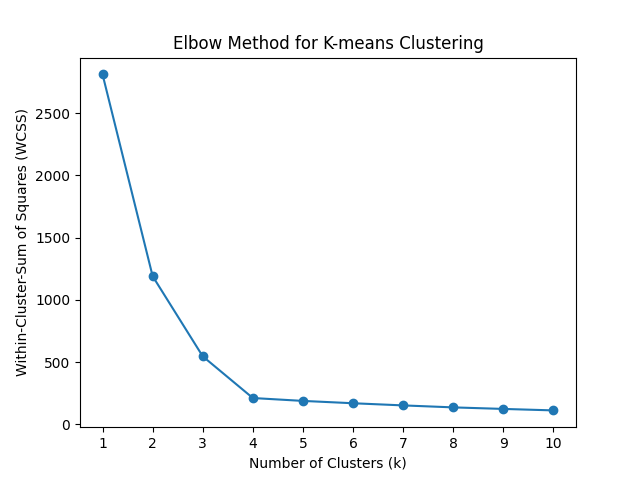
The Elbow Method helps identify the appropriate number of clusters by plotting the Within-Cluster-Sum of Squares (WCSS) against the number of clusters (k). WCSS represents the sum of squared distances between each data point and its assigned cluster centroid. The idea is to find the value of k where adding more clusters does not significantly improve the WCSS.
The Elbow Method involves the following steps:
- Perform K-means clustering for different values of k.
- Compute the WCSS for each k value.
- Plot the k values on the x-axis and the corresponding WCSS values on the y-axis.
- Examine the resulting plot. The "elbow" point, where the plot forms a noticeable bend or kink, indicates the optimal number of clusters. This point represents a balance between low WCSS (tight clusters) and a reasonable number of clusters.
However, it's important to note that the elbow point is not always clearly defined, and the interpretation can be subjective. In some cases, the plot may not exhibit a distinct elbow, making it challenging to determine the ideal number of clusters.
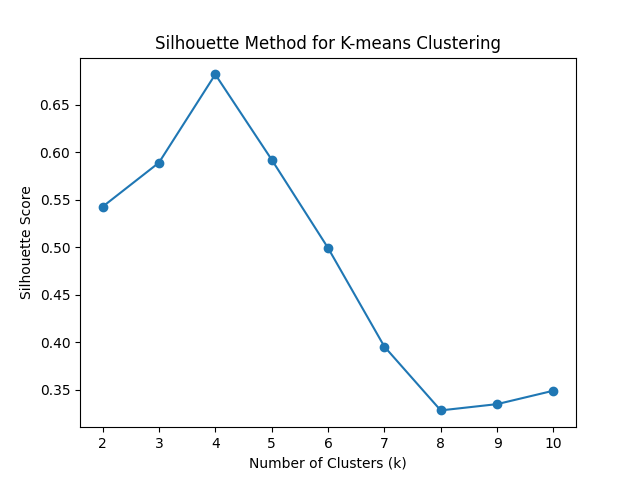
The Silhouette Method
The Silhouette Method assesses the quality of clusters by measuring how well each data point fits into its assigned cluster compared to other nearby clusters. It quantifies the cohesion and separation of the clusters. The silhouette coefficient ranges from -1 to 1, where higher values indicate better-defined and more distinct clusters.
The Silhouette Method involves the following steps:
- Perform K-means clustering for different values of k.
- Calculate the silhouette coefficient for each data point, which is a measure of how close the data point is to its assigned cluster compared to other clusters.
- Compute the average silhouette coefficient for each k value, representing the overall quality of the clustering solution.
- Plot the k values on the x-axis and the average silhouette coefficients on the y-axis.
- Examine the resulting plot. The highest silhouette coefficient suggests the optimal number of clusters, as it indicates well-separated clusters with minimal overlap.
The Silhouette Method provides a more objective measure to evaluate cluster quality compared to the Elbow Method. However, it is computationally more expensive, as it requires calculating the silhouette coefficient for each data point.
Both the Elbow Method and the Silhouette Method serve as useful tools to determine the optimal number of clusters in K-means clustering. It is often recommended to consider the results from both methods and make an informed decision based on the specific characteristics and requirements of the dataset.
Implementing K-means Clustering in Python
Alright, time to get our hands dirty. We're going to do a full K-means clustering code walkthrough in Python.
Required Libraries and Preparation
Like any great cook, a data scientist needs their tools. Here's what we'll need for this recipe:
import numpy as np
import pandas as pd
from sklearn.cluster import KMeans
import matplotlib.pyplot as plt
from sklearn.preprocessing import StandardScaler
Next, let's generate some sample data for our clustering party:
# Creating a random seed for reproducibility
np.random.seed(42)

# Creating two clusters of data
X1 = np.random.normal(0, 1, (100, 2))  # cluster 1
X2 = np.random.normal(5, 1, (100, 2))  # cluster 2

# Concatenating the clusters to get the final dataset
X = np.vstack((X1, X2))
Detailed Walkthrough of Code Implementation
Now, we'll show the K-means algorithm how we party in Python:
Step 1: Standardize the data
scaler = StandardScaler()
X_scaled = scaler.fit_transform(X)
Step 2: Fit the K-means model
kmeans = KMeans(n_clusters=2, random_state=42)
kmeans.fit(X_scaled)
Step 3: Predict the clusters
clusters = kmeans.predict(X_scaled)
Step 4: Plot the data and centroids
plt.scatter(X_scaled[:, 0], X_scaled[:, 1], c=clusters, cmap='viridis')
plt.scatter(kmeans.cluster_centers_[:, 0], kmeans.cluster_centers_[:, 1], s=300, c='red')
plt.title('Clustered Data')
plt.xlabel('X1')
plt.ylabel('X2')
plt.show()
Interpreting the Output
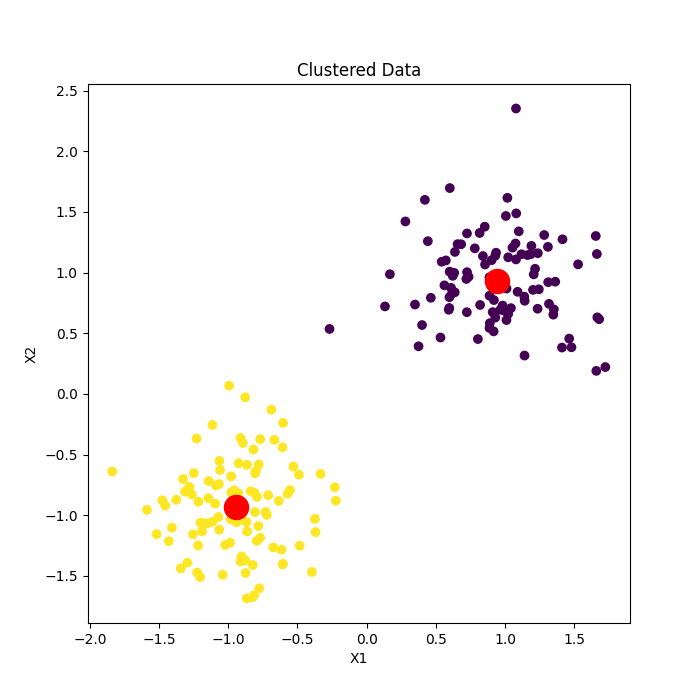
The red points represent the 'heart' of each cluster, i.e., the centroid. Each data point is colored according to its assigned cluster.
The Strengths and Weaknesses of K-means Clustering
Where K-means Shines
Like a savvy superhero, K-means has its strengths. Here's where K-means flexes its clustering muscles:
1. Simplicity: K-means is like your reliable old lawnmower. It’s easy to understand, implement, and it gets the job done.
2. Efficiency: K-means runs fast, especially on large datasets. It's like the Flash of the clustering algorithms, making it great for preliminary cluster analysis.
3. Adaptability: K-means can adapt to a variety of data and can reveal patterns that other algorithms might miss. It's like your favorite multi-tool - always ready to tackle any clustering challenge!
Potential Pitfalls and Limitations of K-means
But K-means, like all of us, has its Achilles' heel. Here are a few things to watch out for:
1. Dependence on K: K-means is heavily dependent on the initial choice of K. It's a bit like being the first to order at a group dinner - your choice sets the tone for the rest!
2. Sensitivity to Initialization: K-means can produce different results with different initial centroids. It's as if your GPS gave different routes every time you restarted it. This is why methods like K-means++ are used to get good initial centroids.
3. Assumes Spherical Clusters: K-means assumes clusters are spherical and evenly sized, struggling with elongated or irregularly shaped clusters. If your data is like a Picasso painting, K-means might not be your best tool.
When to Use (and Not to Use) K-means Clustering
So, when do we bring out our K-means superhero?
Use K-means when:
- You have a large dataset, and efficiency is a top priority.
- You have a good sense of the number of clusters.
- Your data is well suited to spherical clusters.
Avoid K-means when:
- Your data contains outliers, as K-means is sensitive to them. (Hint: a caped crusader known as DBSCAN might be of help here.)
- The clusters are of different sizes and densities.
- You have no idea what value of K to pick.
And there you have it – the good, the bad, and the optimal about K-means. Remember, no algorithm is one-size-fits-all, so make sure K-means suits your data before you put it to work.
Applications of K-means Clustering
Practical Use-Cases in Various Industries
Alright, so we've got the K-means algorithm down pat, but where does it shine in the real world? Let's tour through a few industries and see K-means in action.
1. Retail: Imagine you're managing a superstore. You can use K-means to segment your customers based on purchase history, thereby identifying potential targets for marketing campaigns. It's like creating your own shopping Avengers, each with their unique tastes!
2. Finance: K-means can be your ace-in-the-hole for credit risk analysis. By segmenting customers into different clusters based on income, credit history, and loan amount, you can predict who's more likely to default. Kind of like financial fortune-telling, but backed by math.
3. Telecom: Wondering why customers are jumping ship? Apply K-means to churn analysis. By grouping customers based on usage stats, service complaints, and tenure, you can identify who's at risk and why. It's like a crystal ball for customer happiness.
4. Healthcare: K-means has been used in health tech for patient segmentation, identifying similar groups based on health records. This can help in predicting disease risk and personalizing treatment. A more targeted approach to keeping the doctor away!
Success Stories of K-means Clustering
K-means has some serious star power when it comes to success stories. Here are a couple of examples.
1. Uber: Uber uses K-means to create a geospatial boundary for neighborhoods. It helps in understanding the demand dynamics and improves the efficiency of their ride-sharing service. Like an invisible city planner, ensuring your ride arrives as quickly as possible!
2. Spotify: Spotify has been known to use K-means to segment songs into different clusters based on attributes like danceability and energy. This helps in building a recommendation system that curates your daily mixes. It's like your personal DJ, always ready with the perfect track!
Advanced Topics
Variations of K-means: K-means++, Mini Batch K-means
There's more than one flavor of K-means. Like the artisanal doughnuts of data science, each one brings a unique twist to the table.
K-means++ is like K-means but with a dash of sensibility when choosing the initial centroids. It employs a clever initialization trick to avoid poor clusterings that can sometimes plague the standard K-means. It's like bringing GPS to your road trip - makes getting to the destination a whole lot smoother!
Mini Batch K-means is your speed racer variant. Instead of using the whole dataset each iteration, it uses a random sample, reducing the computational cost and making it suitable for larger datasets. It's like your express checkout line, getting you through the grocery queue faster!
Comparison with Other Clustering Algorithms: DBSCAN, Hierarchical Clustering
Not all clustering algorithms are created equal. Each one has its strengths and weaknesses, just like different superheroes.
DBSCAN is like your big friendly giant, handling noise and outliers with ease. It doesn't require a predefined number of clusters and can find arbitrarily shaped clusters, but struggles with clusters of varying density.
Hierarchical clustering is like your family tree enthusiast. It builds a hierarchy of clusters, which can be visualized using a tree-like diagram called a dendrogram. This lets you choose the number of clusters after the algorithm has run, but it can be computationally intensive on large datasets.
How K-means Fits in the Bigger Picture of Machine Learning
K-means is just one tool in the mighty machine learning toolbox. It's a popular clustering algorithm and forms a fundamental part of unsupervised learning. But remember, data science is a team sport - K-means works best when used in conjunction with other data preprocessing tools, feature engineering techniques, and machine learning models.
Conclusion
Recap of the Key Points
We've traveled a long, exciting road together, dear reader. Like a well-planned road trip, let's revisit some of the key sights:
- Understanding K-means: We plunged into the nitty-gritty of the K-means algorithm, its concept, and how it uses centroids and the mystical K-value to form clusters.
- The K-means Process: We broke down the step-by-step process of K-means, from the selection of initial centroids to the iterative process of assigning points and recalculating centroids.
- Choosing the Optimal Number of Clusters: We looked at the Elbow and Silhouette methods to help us make the big decision: how many clusters to go for?
- Applications of K-means: We discovered how K-means is making waves in industries like retail, finance, telecom, and healthcare.
- Strengths and Weaknesses of K-means: We weighed the pros and cons of K-means, understanding when to use it and when to consider other algorithms.
- Python Implementation: We rolled up our sleeves and got our hands dirty with some Python coding, bringing the K-means algorithm to life.
- Advanced Topics: Finally, we explored the variations of K-means and compared it with other clustering algorithms, understanding where K-means fits into the grand scheme of machine learning.
The Future of K-means Clustering in Machine Learning
K-means has been around the block for a while, but it's not going anywhere anytime soon. As data continues to explode in volume and complexity, K-means will remain a steadfast tool in the data scientist's toolkit, adapting and evolving with the times.
But remember, machine learning isn't static. Expect to see K-means merging with other techniques, powering new algorithms, and being used in creative ways we can't even imagine yet. So, keep an eye on K-means; it might just surprise you.
References
Kmeans sklearn
Kmean domino data lab
Kmeans++ Wiki
DBSCAN Github