After diving into regression analysis, I couldn't wait to test my newfound skills on some real-world data. Luckily, Kaggle has just the thing - they're hosting a competition called 'History of Baseball' and, even better, they've provided a dataset for it!
I had a blast analyzing Paul dePodesta's predictions and statistical findings, using linear regression to put them under the microscope. For a full breakdown of my analysis, hit this link: Moneyball Predictions Kaggle Script
But if you just want the juicy bits, here's a quick summary:
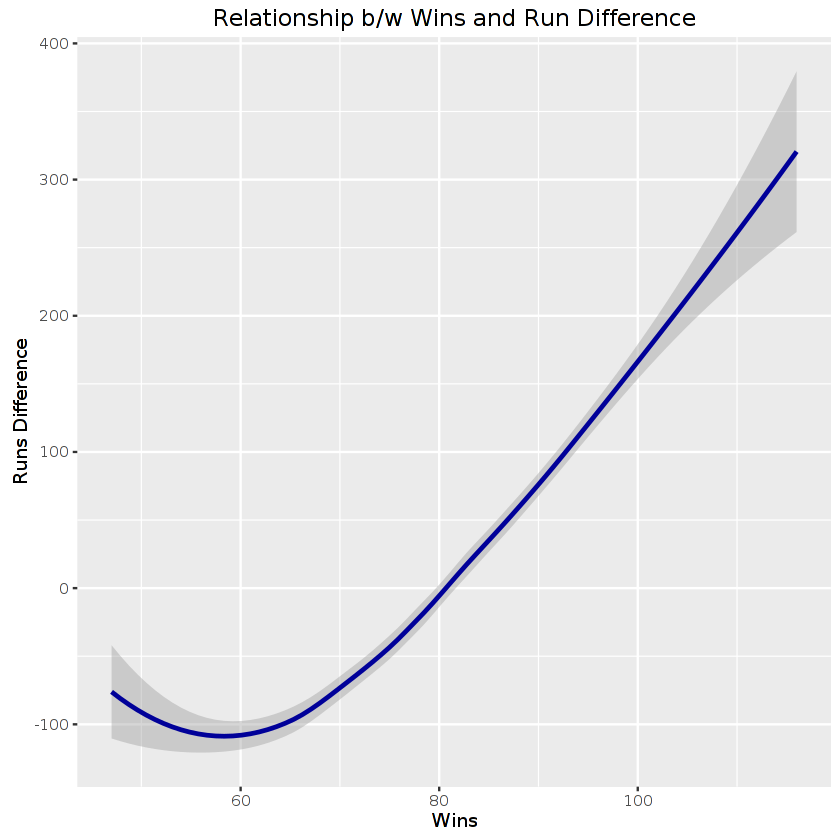
--> Lo and behold, there's a linear relationship between the number of wins and run difference!
--> W = the magic number of wins the Oakland Athletics needed to qualify for the playoffs.
Paul dePodesta guessed 95, our model said 93, and the actual cutoff? A mere 92 wins.
--> R = Runs scored by the Oakland Athletics in 2002.
We predicted a solid 800 runs, and would you believe it? They actually scored 800 runs!
--> RA = Runs allowed by the Oakland Athletics in 2002.
We estimated 671 runs, and they only let in 654. Not too shabby, if I do say so myself.
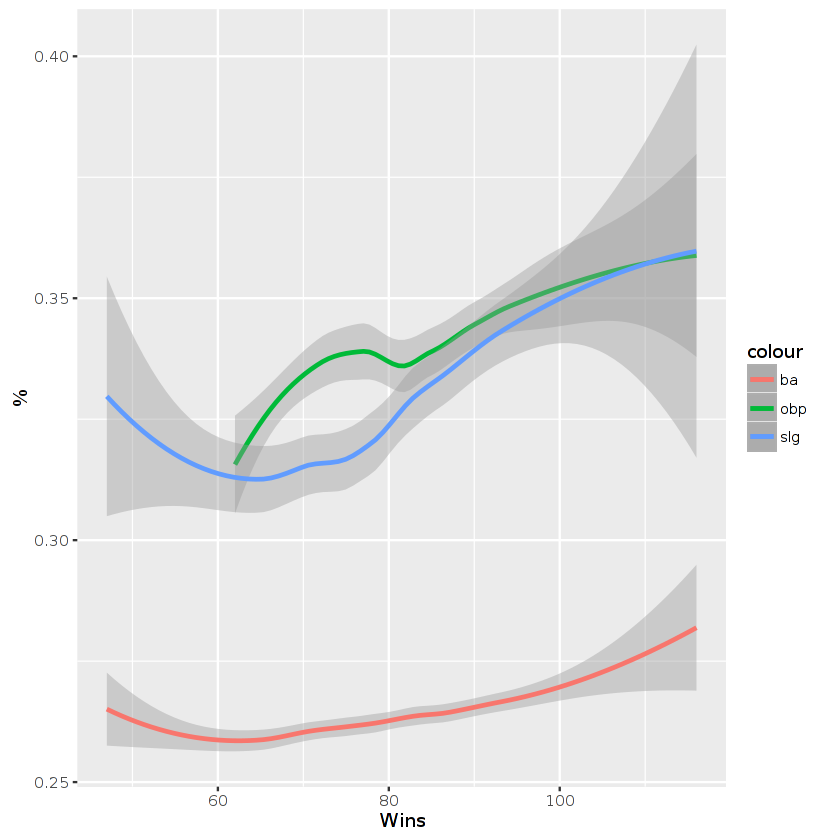
--> We backed up Paul dePodesta's hunch that OBP and SLG are the real MVPs when it comes to baseball statistics.