Hey there! Let's talk about this dataset from RealClearPolitics and the US Presidential Election. Before we dive in, let's get on the same page about a few things:
- The US Presidential Election happens every four years.
- There are 50 states in the US and each gets a certain number of electoral votes based on its population.
- Whoever gets the most electoral votes wins the election.
Got it? Great. Now let's talk about the dataset and how we handled missing data.
The dependent variable in our analysis is whether the state went to a Republican (1) or a Democrat (0). Our independent variables are Rasmussen, SurveyUSA, DiffCount, and PropR.s. Unfortunately, more than 50% of our data was missing, but we didn't want to lose it, so we used the Multiple Imputation by Chained Equations (mice) package to fill in the gaps.
After imputing the data, we split it into training and testing data. We used data from 2004 and 2008 for training, and data from 2012 for testing. We did logistic regression using SurveyUSA and DiffCount as the independent variables. If you're interested, you can check out the full script here.
Now, here's where things get interesting. In our analysis, we predicted that the Republicans would win Florida, but as we all know, the Democrats ended up taking the state. So, we had to figure out where we went wrong.
We took a closer look at our prediction mistake, and here's what we found:

As you can see, our model gave Florida to the Republicans, but they actually went to the Democrats. Oops!
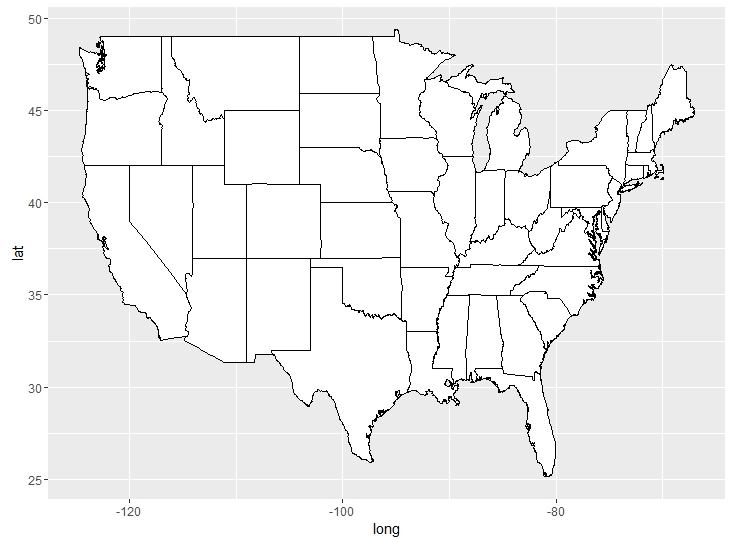
To make things a bit clearer, here's a map of the US:

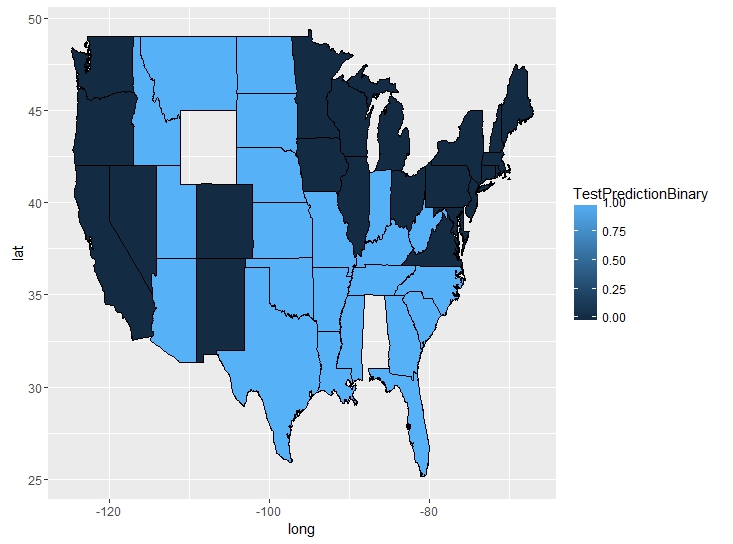
And here are our predictions by state (with light blue representing the Republicans):

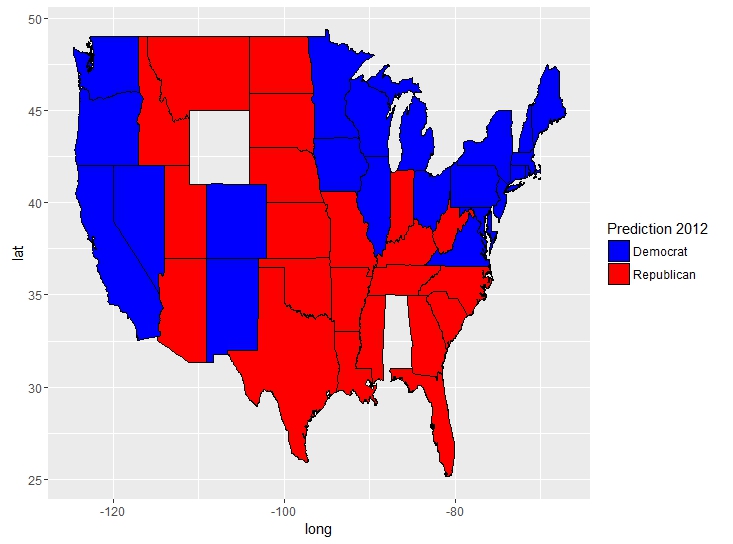
And finally, here are our predictions with discrete outcomes:

So, there you have it. We may have been a bit off with our prediction for Florida, but overall, we had a pretty good sense of how the election would turn out. And let's be real, predicting the future is always a bit of a gamble.