Let's talk about SparkR! It's an R package that provides a lightweight frontend to use Apache Spark from R. I used RStudio and Spark 1.6.1 for this exercise.
SparkR has a distributed data frame implementation that supports operations like selection, filtering, and more. Cool, right?
In RStudio, run the following code to check the system environment variables for Spark home:
Sys.getenv()If you don't see SPARK_HOME set or the path is incorrect, don't worry! You can change it via the environment variables. Once everything is working fine, run the following code to load the SparkR library and pass the necessary drivers:
library(SparkR, lib.loc = c(file.path(Sys.getenv("SPARK_HOME"), "R", "lib")))
sc <- sparkR.init(master = "local[*]",
sparkEnvir = list(spark.driver.memory="2g",
sparkPackages="com.databricks:spark-csv_2.11:1.0.3"))
sqlContext <- sparkRSQL.init(sc)
The sc variable is the Spark context, which is the entry point into SparkR. We created the Spark context using sparkR.init.
Now, we're ready to use the SparkR API! Let's read the data frame and convert it into a Spark DataFrame:
df_o <- read.csv("Iris.csv")
df <- createDataFrame(sqlContext, df_o)
head(df)
Let's do some simple operations using SparkR. You can find the API here:
# select and filter operations
head(select(df, df$SepalLengthCm, df$Species))
head(filter(df, df$SepalLengthCm > 5.0))
# Compute average PetalLengthCm and group by Species
head(agg(groupBy(df, "Species"), PetalLengthCm="avg"))
# Returns the schema of this DataFrame as a structType object
dfSchema <- schema(df)
dfSchema
# Sort the DataFrame by the specified column
head(arrange(df, df$SepalLengthCm))
# Sort in decreasing order
head(arrange(df, "SepalLengthCm", decreasing = TRUE))
# Print the first numRows rows of a DataFrame
showDF(df)
# Running SQL Queries from SparkR
registerTempTable(df, "iris")
irisSepalLGreater5 <- sql(sqlContext,
"SELECT Id, Species FROM iris WHERE SepalLengthCm > 5.0")
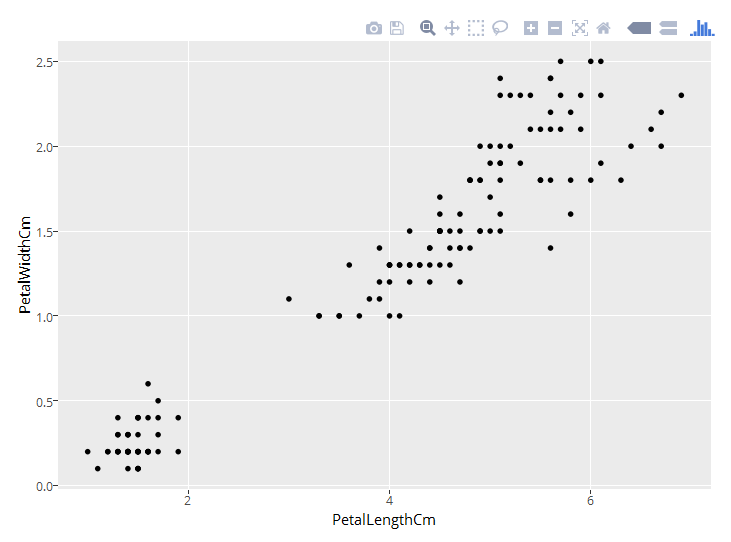
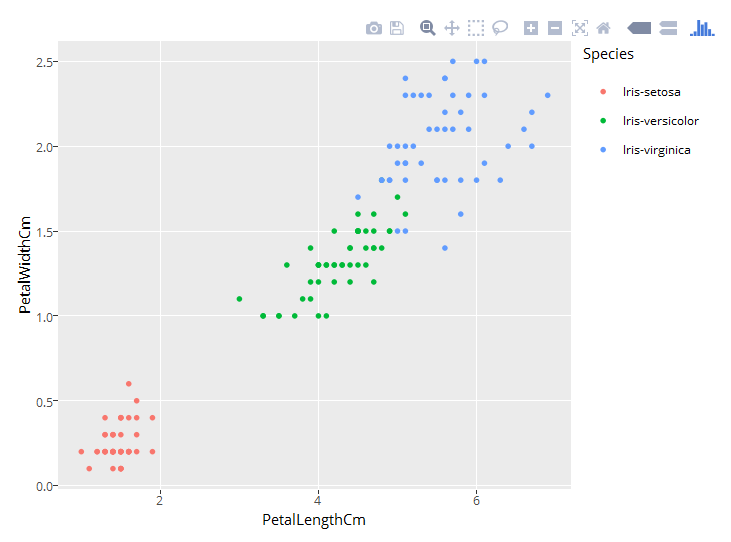
head(irisSepalLGreater5)Don't worry if it seems confusing at first. When we use SparkR, we can do all the operations that we do in R. For example, I used ggplotly to create some infographics. You can find the full script here.
Check out these cool visualizations I created: